Benchmarking Apache Kafka deployed on OpenShift with Helm
Running Apache Kafka on Open Shift in a Production Environment
We have previously shown how to deploy OpenShift Origin on AWS. In this post, well walk you through installing Apache Kafka and Apache Zookeeper with Kubernetes Helm. We'll also produce some useful and valuable benchmarks like write throughput and inbound message rate. Our goal is to collect benchmark data to show that Apache Kafka can not only operate inside a container orchestration platform like OpenShift , but can be seriously considered as a valid solution for a production-ready environment.
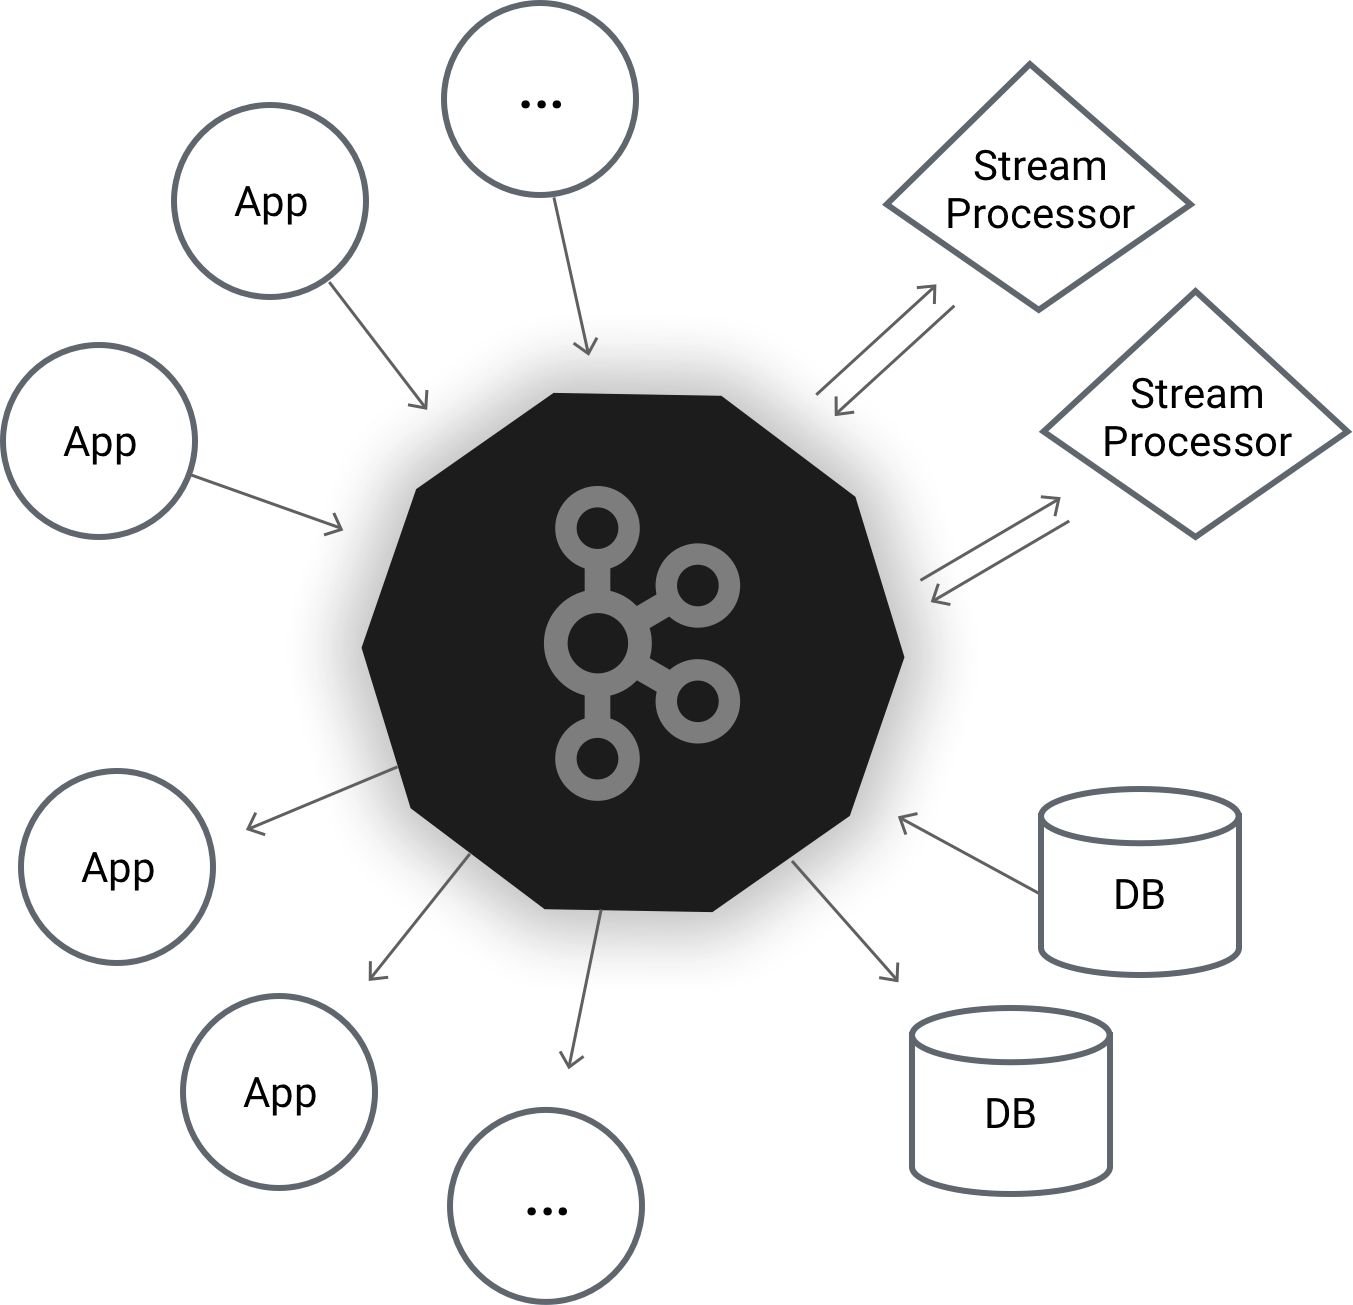
This post assumes that you already have some knowledge of Apache Kafka, its use cases and its architecture components, the intro on the official Apache Kafka website is a good place to start if you don't.
Prerequisites
Helm
We use Helm to deploy applications on the cluster. Helm is a tool for managing Kubernetes charts. A chart is a set of preconfigured Kubernetes resources - it's a little like a package manager (e.g. apt/yum/Homebrew/etc) for Kubernetes. Helm allows us to have a reproducible, controlled and customisable installation of OpenShift resources in our Kubernetes cluster.
The reason why we chose Helm is because it's very powerful, it's actively supported by the community around Kubernetes, and it's bundled with several features that the internal OpenShift template mechanism doesn't have.
The Helm architecture is made up of two main parts:
- A client which runs locally.
- A server which runs in the cluster.
You need to first install Helm locally on your machine, see installation notes here . Once the client has been installed locally, it is time to install the server, also knowns as the tiller , in the cluster. When the user runs commands locally, they are delivered to the server to be executed.
Configure RBAC
Openshift Origin comes with Role Based Access Control (RBAC) enabled. It is used to configure policies and roles which allow access to the components of the cluster. We need to assign to the tiller the proper role in order to create/update/delete resources in the cluster.
The following instructions will install the tiller in the kube-system namespace. This is a namespace where only users with admin role have the privileges to operate. If we want to give our GitHub user access to the kube-system namespace, we need to connect to one of the master nodes via the bastion host and run: oadm policy add-cluster-role-to-user cluster-admin where username is your GitHub user name.
The username now has the cluster-admin role and can execute any operations against any namespaces in the cluster. Connect to command-line and copy to the clipboard the command: oc login https://openshift-master.os.nearform.net --token= Once executed on the local machine this will login the user to the cluster and it is then possible to execute operations with admin level via the oc command against the cluster.
Next, create the serviceaccount tiller within the namespace kube-system : oc create serviceaccount tiller -n kube-system From the master node run: oadm policy add-cluster-role-to-user cluster-admin -z tiller -n kube-system Finally run locally: helm init --service-account tiller --tiller-namespace kube-system Doing so, the tiller will be installed in the kube-system namespace and it will have privileges to operate against all the namespaces in the entire cluster. Disclaimer : Note that with this approach tiller has been installed under the kube-system and it has cluster-admin privileges. It can execute all actions against every resource across the entire cluster. Running it could be potentially dangerous!
Another approach is to install tiller in a project that we already created. In this case we are by default admin of the project. We can then install tiller in the project and assign to it the admin role. In this way, it can create/read/update/delete resources only in that namespace.
Architecture
It is important to understand the general architecture of the Apache Kafka deployment.
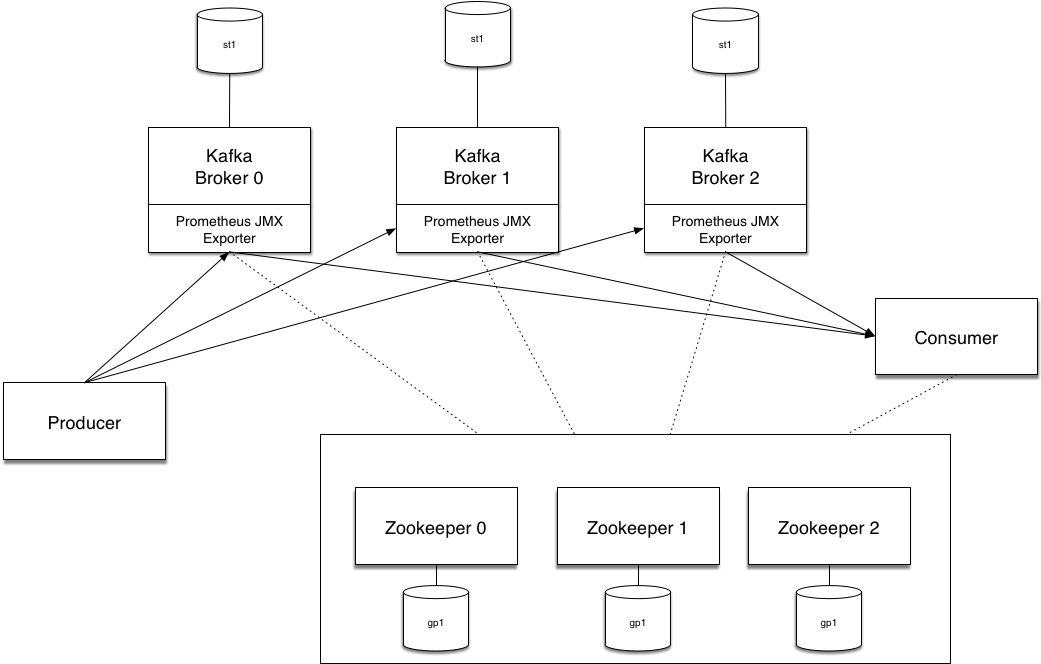
The basic concepts in Apache Kafka are producers and consumers . Producers publish messages to topics, and consumers consume from topics. The brokers are Kafka nodes which store messages for the consumers, ready to be consumed at the rate of the consumer. The brokers run in StatefulSets .
As we need to persist Kafka message storage, it is necessary to enforce this by using proper Kubernetes resources in the cluster. By definition, pods deployed by using a Deployment object are ephemeral and they dont have any sort of identity. They can be destroyed and replaced without any issue. Different StatefulSets are resources that allow that every single pod maintain an unique, sticky identity and associate each of them to an unique different volume which stores the data of the application. We do this in OpenShift by using Stateful Resources which allows us to persist message state.
In the same pod but in a separate container, we run Prometheus JXM Exporter . This approach provides a high level of separation and encapsulation. It is a common microservices pattern called Sidecar . The exporter is composed of two main components:
- a collector that configurably scrapes and exposes Apache Kafka mBeans of a JMX target
- an HTTP Server that receives the scraped metrics and exposes them via an API in a Prometheus compatible format
We can then consume these metrics from Prometheus. It is just required to set up the HTTP server address of the Prometheus JMX Exporter in the Prometheus configuration file. It is beyond the scope of this article to explain this, for more information please read the Prometheus documentation .
The choice of running Prometheus JMX Exporter to extract metrics has been done by taking into consideration different aspects such as the grade of integration of the current monitoring solutions in an environment like Kubernetes, the simplicity of deploying, configuration interface and, last but not least, support from the community. Prometheus JMX Exporter allows us to define which metrics we want to expose and track them down in Prometheus with the added advantage that the latter comes out of the box with great support for Kubernetes internal cluster metrics.
The broker message stores are backed by external network volumes, this gives us better read and write performance for Kafka, as well as data resiliency. We'll talk about volumes in the next section.
Finally, no Apache Kafka deployment is complete without ZooKeeper . ZooKeeper is the glue that holds it all together, and is responsible for:
- electing a controller (Apache Kafka broker that manages partition leaders)
- recording cluster membership
- topic configuration
- quotas (0.9+)
- ACLs (0.9+)
- consumer group membership (removed in 0.9+)
Deployment of Apache Kafka
The installation of Apache Kafka and Zookeeper can now be executed by using Helm. We are going to provision the Apache Kafka cluster in a new OpenShift project.
Lets create a new project: oc new-project kafka --display-name="Apache Kakfa" --description="Apache Kafka cluster using Stateful Sets and Zookeper" This will create a new project and consequently a new namespace.
Before launching the installation, it is necessary to set some important properties in the cluster settings. For limiting and securing the cluster, OpenShift doesnt allow running containers which have low uid and guid numbers. It is needed to set the Security Context constraints (SCCs) in this way we can run Zookeeper as privileged containers.
Run the following from the master machine: oc edit scc anyuid and edit the file by adding at the end:
users:
- system:serviceaccount:kafka:default
The service account default can now run containers under the kafka project/namespace with any uid.
Last step before spinning up the installation, is to set up the wanted values in the Helm configuration. The file kafka.yaml is under the values folder and it defines the configuration used in our scenario. The values defined there are more than enough to spin up a fully working cluster. Under the route property it is necessary to setup the application_domain url in the form <your-app.apps. , if you want to reach the Apache Kafka dashboard from the external world.
Lets move on with the installation by running the following Helm install command: helm install --name kafka --namespace kafka -f values/kafka.yaml charts/kafka Here are the resources that we have just deployed in the cluster.
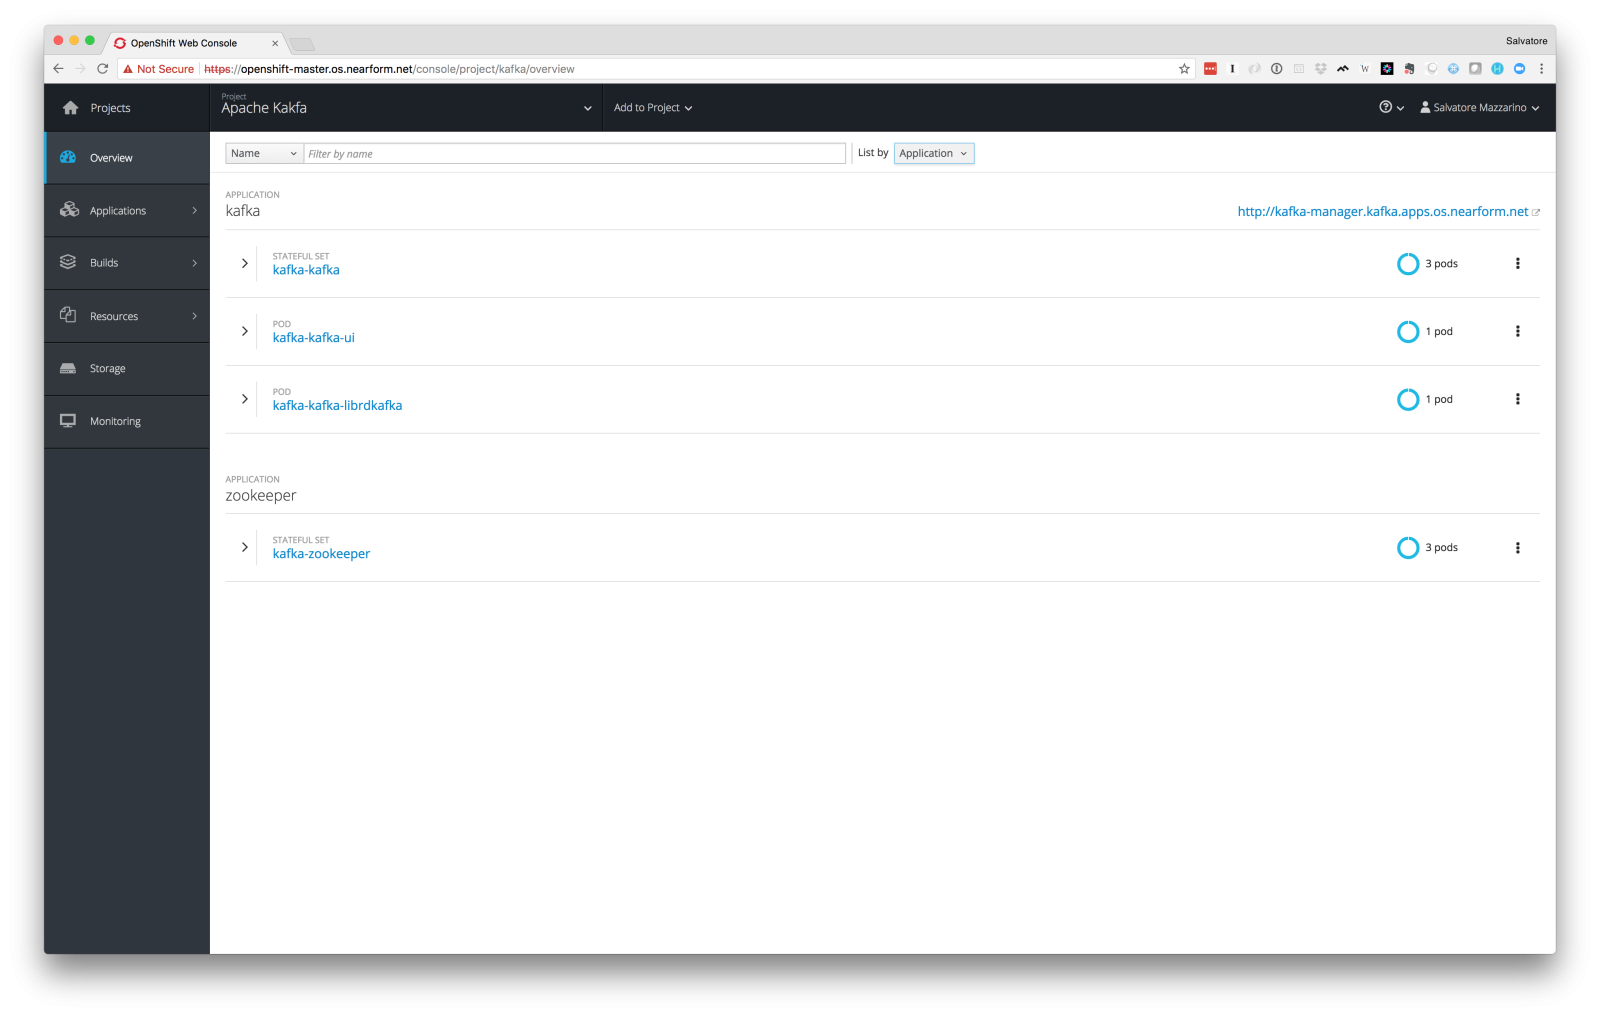
We have deployed 3 Kafka brokers, 3 Zookeeper ensembles, a pod which runs Yahoo Kafka Manager (a useful dashboard which we use to manage the cluster), and a pod which runs librdkafka (an Apache C/C+ library containing support for both Producer and Consumer). We will use it for push messages to the cluster and so simulate a real scenario.
Cluster Configuration
After a few minutes of running Helm we should have our Apache Kafka cluster running and ready to accept requests. Now we need to set it up. The first thing to do is to create a new topic, let's use the Apache Kafka manager that we have just installed.
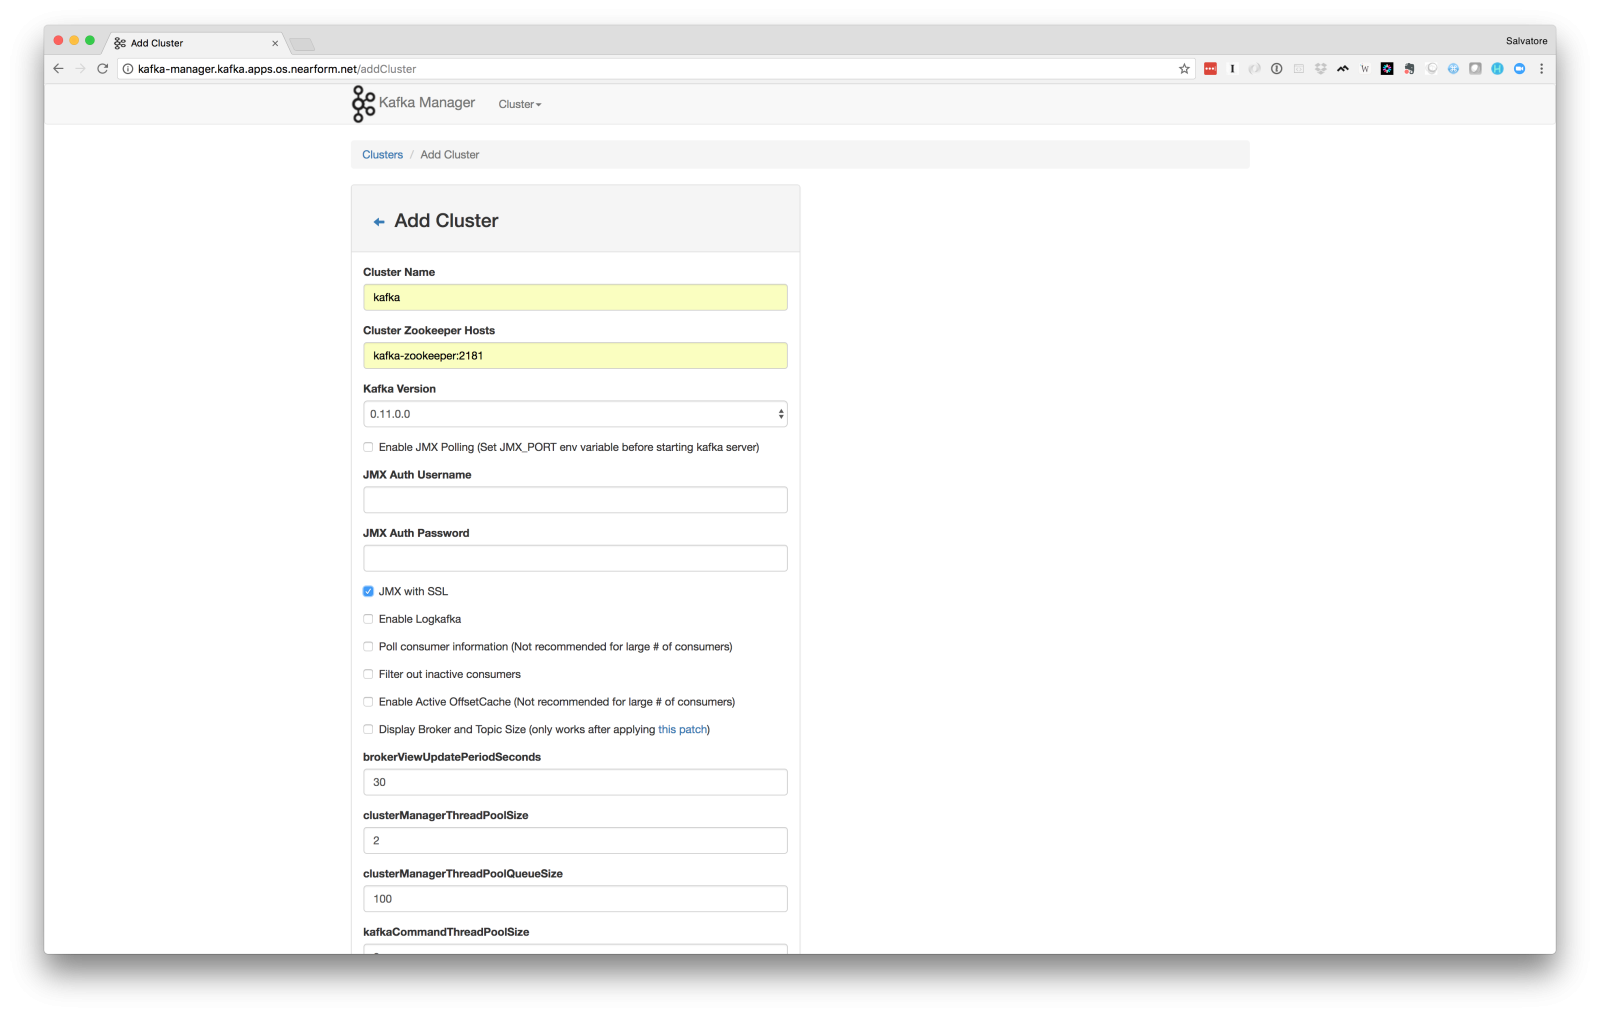
Click to the public route which points to the dashboard and then click on the top bar to show Add Cluster and configure it as follows:
- Cluster Name: kafka
- Cluster Zookeeper Hosts: kaka-zookeeper:2181
- Kafka Version: 0.11.0.0
- Enable JMX Pooling
Limitations
It is very important for the following setup that all the OpenShift app nodes are spread across all the AWS Availability Zones. Zookeeper has been designed to be fault tolerant and to do that, two or more pods can't run on the same machine. This is defined in StatefulSets:
affinity:
  podAntiAffinity:
    requiredDuringSchedulingIgnoredDuringExecution:
       - topologyKey: "kubernetes.io/hostname"
         labelSelector:
           matchLabels:
             app: {{ include "name" . | quote }}
             release: {{ .Release.Name | quote }}
If this is not configured correctly, you could see an error like:
Error: No nodes are available that match all of the following predicates:: MatchInterPodAffinity (1), MatchNodeSelector (3), NoVolumeZoneConflict (4).Also note that Apache Kafka and Zookeeper are not exposed to the external world, they are only reachable from the internal cluster. This is a good approach and follows security best practices.
Benchmarks
We are going to see which value of write throughput we can reach by having the following setup of Apache Kafka running on AWS.
We run the following test in an OpenShift cluster, deployed on AWS with the following configuration:
AWS Parameters:
- 3 app nodes: m4.2xlarge
- 3 brokers attached to 3 EBS
st1volumes of 500 GiB each one
Openshift Parameters:
- OpenShift origin release 3.6 (openshift v3.6.0+c4dd4cf)
- Kubernetes 1.6.1 (kubernetes v1.6.1+5115d708d)
- No CPU and/or memory limits for the brokers running in the cluster (note this is not absolutely recommended in a production environment, always define requests and limits as per your requirements)
Apache Kafka Parameters:
- 1 Producer
- 3 Partitions
- 1 replication factor
- No ack
- message size 100 bytes
request.timeout.ms600000batch.num.messages10000queue.buffering.max.ms1000
In order to get the best performance possible we also tune the JVM. Here the options that we passed to the Kafka process:
- name: KAFKA_HEAP_OPTS
  value: "-Xmx8G -Xms6G"
- name: KAFKA_JVM_PERFORMANCE_OPTS
  value: "-server -XX:MetaspaceSize=96m  -XX:G1HeapRegionSize=16M -XX:MinMetaspaceFreeRatio=50 -XX:MaxMetaspaceFreeRatio=80 -XX:+UseG1GC -XX:MaxGCPauseMillis=20 -XX:InitiatingHeapOccupancyPercent=35 -XX:+ExplicitGCInvokesConcurrent -Djava.awt.headless=true"
The reason why we chose the size of a single message to be 100 bytes is that it is relatively easy to reach high throughput when the size of the messages is pretty high. It is then more interesting and more valuable for this analysis to see the result when the size of the message is small. In our experience, the average size of a message is between 50 bytes and, rarely, over 512 bytes.
The other parameters are configured for reaching high throughput, especially the size of the batch and buffering time. Note from the command below that we run librdkafka from the cluster. The Kafka cluster is not accessible from the external world so in order to connect to the brokers we must run the producers in the cluster.
oc -n kafka exec -it kafka-kafka-librdkafka -- examples/rdkafka_performance -P -t test -s 100 -b kafka-kafka-headless:9092 -X request.timeout.ms=600000 -X batch.num.messages=10000 -X queue.buffering.max.ms=1000This is the output produced from the above command:
% Sending messages of size 100 bytes
% 500000 messages produced (50000000 bytes), 0 delivered (offset 0, 0 failed) in 1000ms: 0 msgs/s and 0.00 MB/s, 47 produce failures, 500000 in queue, no compression
% 1023772 messages produced (102377200 bytes), 523772 delivered (offset 0, 0 failed) in 2000ms: 261865 msgs/s and 26.19 MB/s, 71 produce failures, 500000 in queue, no compression
% 1431919 messages produced (143191900 bytes), 1159830 delivered (offset 0, 0 failed) in 3000ms: 386552 msgs/s and 38.66 MB/s, 96 produce failures, 272090 in queue, no compression
% 2045361 messages produced (204536100 bytes), 1617353 delivered (offset 0, 0 failed) in 4001ms: 404236 msgs/s and 40.42 MB/s, 96 produce failures, 428008 in queue, no compression
% 2615933 messages produced (261593300 bytes), 2115933 delivered (offset 0, 0 failed) in 5003ms: 422894 msgs/s and 42.29 MB/s, 103 produce failures, 500000 in queue, no compression
% 3046783 messages produced (304678300 bytes), 2719854 delivered (offset 0, 0 failed) in 6003ms: 453047 msgs/s and 45.30 MB/s, 123 produce failures, 326929 in queue, no compression
% 3743530 messages produced (374353000 bytes), 3243530 delivered (offset 0, 0 failed) in 7003ms: 463119 msgs/s and 46.31 MB/s, 125 produce failures, 500000 in queue, no compression
% 4040847 messages produced (404084700 bytes), 3850013 delivered (offset 0, 0 failed) in 8003ms: 481031 msgs/s and 48.10 MB/s, 157 produce failures, 190834 in queue, no compression
% 4612023 messages produced (461202300 bytes), 4293464 delivered (offset 0, 0 failed) in 9111ms: 471225 msgs/s and 47.12 MB/s, 173 produce failures, 318566 in queue, no compression
% 5247725 messages produced (524772500 bytes), 4756049 delivered (offset 0, 0 failed) in 10111ms: 470371 msgs/s and 47.04 MB/s, 173 produce failures, 491676 in queue, no compression
% 5647091 messages produced (564709100 bytes), 5416100 delivered (offset 0, 0 failed) in 11111ms: 487442 msgs/s and 48.74 MB/s, 181 produce failures, 230991 in queue, no compression
% 181 backpressures for 5922298 produce calls: 0.003% backpressure rate
The result can be read in this way; the message transfer rate is approximately 500K messages per second, 50MB/s megabytes per second. Considering heuristically that every event produced can be considered as a message, with such a result we can handle approximately 500K req/sec . In other words, inbound traffic which should be suitable for most Enterprise IT systems!
Summary
You can find the Kafka Helm chart under the repository nearform/openshift-kafka .
We considered the most common Apache Kafka architecture deployed in a container orchestration platform like OpenShift. We used StatefulSets as Kubernetes resource to handle the internal state of the Kafka cluster components. We provisioned the underlying infrastructure with the failure in mind. All the components are spread across the AWS Availability Zones in the same region. Lastly, we tuned properly the Kafka brokers and producers parameters to have the highest possible throughput.
Conclusion
We started this post by defining a clear goal. We wanted initially to prove that Apache Kafka can run in an OpenShift cluster without any difficulties and generate enough write throughput and inbound message rate to be used in a production environment.
In a world that is quickly migrating to containers, it was very clear to us that we needed to embrace this challenge and try to run a complexly distributed platform like Apache Kafka in a container orchestration platform.
From our test results, we conclude that Apache Kafka can be a valid solution for many production containerised environments with no major caveats.
Insight, imagination and expertly engineered solutions to accelerate and sustain progress.
Contact